Poll of polls update, and some projections, too.
Despite some excitement in individual polls, the polls as a whole show National still well above 50%, and New Zealand First still a long way below 5%.
There have been four polls published since we updated the Poll of Polls last Monday. Our updated estimates show continuing trends against National and Labour (each of whom drop about half a point this week), and in favour of the Greens (who gain most of a point). We now estimate the Greens at almost 11% support and climbing. As I noted last week, some of the Greens’ longer term prospects rest on whether they can get their 12th to 15th ranked MPs into Parliament, given those particular candidates’ possible role in broadening the Greens’ support coalition in suburban New Zealand. That will be one of the most interesting aspects of election night.
Results for New Zealand First are mixed across the four polls this week, with a range from 2.2% to 4.9% estimated support. Our overall estimate is that New Zealand First’s support is little changed from last week, up a touch to 2.8%.
The other incumbent parties continue to cement their cellar-dweller status.
Even though the election is in five days, our estimates are based on polls with sampling periods centered at least 12 days before election day. We may see one or two more polls this week, but even those will likely be based on samples centered a week or more before polling takes place. Given that there are some fairly strong trends in parties’ support during the campaign, this could cause any polling-based estimate, including ours, to miss some late shifts in public support.
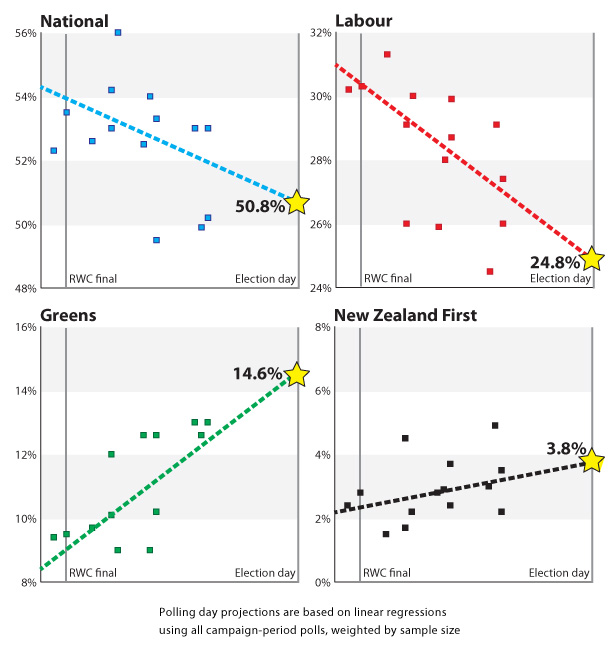
Another way to project Saturday’s results is to run some simple regressions based on all campaign-period polls (weighted by sample size). I did this for the four largest parties, and the results are charted below.

This kind of setup is based on an assumption that the linear trends we have observed in the campaign to-date will continue unabated up to election day. There is always the possibility, of course, that such as an assumption will be wrong. Maintaining that assumption, however, we are able to not only make projections, but also estimate the probability of some important events.
New Zealand First makes 5%?
Using the analysis above, we project that New Zealand First will get 3.8% of the vote. We can also project with 95% confidence that the party will get between 2.3% and 5.2% of the vote. Importantly, we project that there is only a 4% probability New Zealand First will get more than five percent of the vote.
National makes 50%?
We project that National will get an absolute majority of the vote, but a pretty small one (50.8%). Based on this analysis, we think there is a 74% chance that National will get over 50% of the vote.
Readers should note that these fact-based projections are both very different from the predictions on ipredict of these events. As at late Sunday, ipredict thinks there is a 30% chance that National will get a majority; we say 74%. And ipredict thinks there is a 48% chance New Zealand First will break 5% even though no recent poll has shown them over 5%, plenty of polls have shown then a long way short, and their moment in the sun was probably last week rather than this week coming. We say that probability is much lower, 4%. This difference illustrates one of the risks in basing projections on market behavior: The assumption that markets are uniformly efficient and that all market participants are rational. Both those assumptions have been falsified many, many times.
In both of these important areas, the projections are saying the same thing as the Poll of Polls. National will be able to govern alone; and Winston will not return to Parliament. The difference between the Poll of Polls and the projections, which amount to 2.5 points for National, 3.5 for Labour, and almost four points for the Greens, are interesting analytically and important to some MPs and potential MPs, but are not important for the broad result.
(One important warning about the projections in the charts above is that they are out-of-sample predictions, and so are subject to more than usual error. Exactly how much extra error we should add in is uncertain, which is another way of saying that you should take the projections with a grain of salt, over and above the sciency-sounding 95% confidence intervals. In addition, any additional polls this week could make a large difference to these regression-based projections.)