
Bill English and David Farrar spent last week telling fibs about the tax burden high-income families assume. I want to set the record straight with some details about how much the top 10% really pay
In recent days, Bill English and David Farrar have been making a lot of inflammatory statements about how much tax is paid by high-income New Zealanders. For example:
- “The top 10 percent of households contribute over 70 percent of income tax, net of transfers—over 70 percent of income tax, net of transfers.” - English, in Parliament
- “If you take households over $120,000 then you have 17% of the households pay 97% of net income tax.” - Farrar, in the New Zealand Herald
These statements are blatantly false.
In this post, I demonstrate two errors that English and Farrar have made, provide corrected statistics, and comment on the substantive conclusion to be drawn from the correct figures. This post builds on excellent blogging over at The Dim-Post.
Error #1: Addition
In Bill English’s table, he calculates how much tax is paid by households in an income bracket, how much those same families receive in cash welfare transfers (but not any other form of private benefits), and adds them together to get a net figure.
Families earning over $150,000 paid net $7.8 billion. English and Farrar say that is 71% of the total. But when you use the same table and add up the amounts paid by families that earn above $80,000 but below $150,000, you find that those families also contribute a further net $7.6 billion, which is also around 70% of the total net tax.
What?! How the hell can two separate groups of families each pay 70% of the net tax?
The way English and Farrar put together this illusion is to assume that most of the “net tax paid” by middle-income families is not actually paid into “net tax.” Instead, it is put in a separate pool – “money for paying welfare transfers to net tax recipients.” Why use only middle class net taxes for this pool? Never mind why! Only when the “money for paying welfare transfers to net tax recipients” pool is full does “net tax paid” actually start paying towards “net tax.”
Everyone get that? Make sense?
No. It does not make any sense. There is no good reason to do it this way. This is a stupid, nonsensical way to figure out contribution burdens.
The list of silly conclusions that flow from their calculations is long. For example, under the English/Farrar counting rules, high-income families contribute absolutely nothing, not one cent, towards helping the needy with Working for Families payments, the DPB, or unemployment benefits. This is because their $7.8 billion goes into the “net tax” pool rather than the “paying for welfare transfers to net tax recipients” pool. That is, of course, an idiotic conclusion that is unfair to top-income earners, whose taxes do a great deal to support welfare programs.
But it flows straight out of the English/Farrar maths.
Consider also the chart below. The figures are directly from Bill English’s table. Each bar represents the net income tax position of New Zealand households in a $10,000 income band. Red bars represent net tax recipients; black bars represent net tax contributors. David Farrar’s claim that “If you take households over $120,000 then you have 17% of the households pay 97% of net income tax” amounts to a claim that the four bars on the right side of the chart constitute 97% of all the net tax represented by black bars.
That is obviously silly, just by looking at the chart.
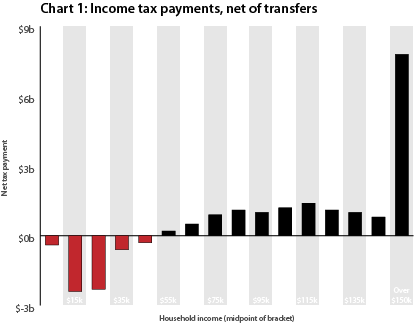
The correct way to calculate the percentage is to divide a group’s net contribution by the total of all net contributions. Correcting for this error in arithmetic, the net income tax contribution of $150,000+ households falls from 71% to 46%. That is a very large change. But there is another error to correct…
Error #2: Omission
Income taxes are a big part of overall taxation, but they are not the only taxes households face. GST is another large tax bill that all people face. It is a tax that is regressive with respect to income. It accounts for 26% of all tax. And it is excluded from the English/Farrar calculations. In order to do a proper comparison of “net tax,” GST needs to be included.
(Of course, there are other taxes (eg. sin taxes) you could also include if you had, say, a Treasury to help you do things properly. A project for another day…)
For GST payments, I used the household GST figures from the Tax Working Group’s GST paper, recalibrated them to account for the new 15% GST rate, and apportioned those decile-based figures across English’s income-based bands, pro-rating where needed. Then I added those payments to net income tax payments to get a total, shown in the chart below.
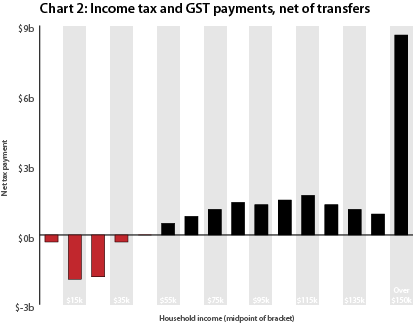
Using these more complete figures, the proportion of net tax paid by $150,000+ households drops further to 43%, a far cry from the 71% touted by English and Farrar.
How much is 43%?
High-income families in New Zealand pay a lot of money in net tax. Just under 10% of families earn more that $150,000 a year, and collectively those families provide 43% of the money provided by all New Zealand families. Is that fair?
To answer that, we need to remember that this is not some random slice of New Zealand families. This is the 10% with the highest incomes. That slice of New Zealand also has a lot in common with the richest 10% in terms of net wealth. What do we know about them?
- The 10% of top income-earning families earn 30% of the income. (Estimate from Stats NZ’s Household Economic Survey 2010)
- The wealthiest 10% of New Zealand families control roughly 50-60% of the wealth (Estimates from New Zealand Institute’s The Wealth of a Nation 2004)
This group earns 30% of the income, has 50% or more of the wealth, and pays 43% of the net tax. Is that an outrage?
I don't think so. Even under a libertarian flat tax regime, this group would pay 30% of the tax. And our country is not a bunch of flat tax libertarians. We have always embraced progressive taxation, and been willing to lend a helping hand to those in need.
We have always known that when you help out people in need, other people pay more than their income share to fund it all.
The fortunate few paying 1.4 times their income share in tax is worthy of everyone’s gratitude. But it does not seem at all an unreasonable burden.
These figures provide a more sanguine and accurate picture of tax burdens in New Zealand than the misleading fear-mongering peddled by Bill English and David Farrar.